Autopsy of llm.c adamw optimizer
we're gona be looking at llm.c commit hash: f1e2ace651495b74ae22d45d1723443fd00ecd3a
the origin of the adamw is in dev/cuda/adamw.cu that they then migrated over to llmc/adamw.cuh
I'm fairly new to cuda but i'm learning and no better way to learn than to profile. The reason for selecting adamw is 2 fold.
- it's memory bound so it's a good sandbox for memory bandwidth
- it starts with an a and was the first kernel in the dev dir ¯\(ツ)/¯
So here's the questions that interest me here:
- What is the theoretical maximum memory bandwidth of my GPU?
- When I run the unmodified
llm.cAdamW kernel, what percentage of that theoretical max does it achieve? - Is this kernel really memory-bound? --> i mean we kind of know the answer to this already, but I want to see what the ncu says
- What happens if I delete the optimizations they've added for the kernel? What happens if I rip out the vectorized memory loads? what happens if I do standard weights multiplication rather than lerp? I want to see the NCU show me the answers to these
- How does
llm.ccalculate the execution grid? - How does the host C++ code handle the "tail" of a tensor that doesn't fit perfectly into a block of 256 threads?
For now that's all that comes to mind. Let's get going.
heads up: i have a measly little gpu on my laptop and i only intend to use that for now. I'll start incorporating rtx3090, 4090s, A100, H100s, multi gpu setups the more time I spend doing this. no point in bleeding right from the start.
Part 1
Questions I'll try to answer in this section:
- What is the theoretical maximum memory bandwidth of my GPU?
- When I run the unmodified
llm.cAdamW kernel, what percentage of that theoretical max does it achieve?
I started with cudaDeviceProp to get the base settings of my puny gpu on my laptop:
/* gpu_bw.cu */

#include <stdio.h>
#include <cuda_runtime.h>

int main() {
	cudaDeviceProp prop;
	cudaGetDeviceProperties(&prop, 0);
	printf("GPU: %s\n", prop.name);
	printf("Compute Capability: %d.%d\n", prop.major, prop.minor);
	printf("Memory Clock Rate: %d KHz\n", prop.memoryClockRate);
	printf("Memory Bus Width: %d bits\n", prop.memoryBusWidth);
	printf("L2 Cache Size: %d bytes\n", prop.l2CacheSize);
	printf("Total Global Memory: %.2f GB\n", prop.totalGlobalMem / (1024.0*1024.0*1024.0));
	double bw_gbps = 2.0 * prop.memoryClockRate * 1e3 * (prop.memoryBusWidth / 8) / 1e9;
	printf("\nTheoretical Peak Memory Bandwidth: %.2f GB/s\n", bw_gbps);
	return 0;
}
then compile and run
$ nvcc gpu_bw.cu -o gpu_bw &&  ./gpu_bw

GPU: NVIDIA GeForce MX450
Compute Capability: 7.5
Memory Clock Rate: 3501000 KHz
Memory Bus Width: 64 bits
L2 Cache Size: 524288 bytes
Total Global Memory: 1.64 GB

Theoretical Peak Memory Bandwidth: 56.02 GB/s
sad face.
Theoretical Peak BW = 2 (-- DDR) × MemoryClockRate (-- cycles/sec) × (BusWidth / 8 -- bytes/transfer)
Plugging in MX450's numbers:
= 2 × 3,501,000,000 Hz × (64 bits / 8) = 2 × 3,501,000,000 × 8 bytes = 56,016,000,000 bytes/s = 56.02 GB/s (Q1: theoretical maximum memory bandwidth of my GPU)
to profile this, I first wrote this simple script
/* profile_adamw.cu */
#include <stdio.h>
#include <stdlib.h>
#include <assert.h>
#include <cuda_runtime.h>
#include <curand.h>
#define ENABLE_FP32
#include "llmc/cuda_common.h"
#include "llmc/cuda_utils.cuh"
#include "llmc/adamw.cuh"
int main() {
const size_t N = 1 << 20; // ~1M parameters for my tiny gpu
float *params, *grads, *m, *v;
cudaCheck(cudaMalloc(¶ms, N * sizeof(float)));
cudaCheck(cudaMalloc(&grads, N * sizeof(float)));
cudaCheck(cudaMalloc(&m, N * sizeof(float)));
cudaCheck(cudaMalloc(&v, N * sizeof(float)));
// some random data on host. similar to make_random_float in dev/cuda/adamw.cu
curandGenerator_t gen;
curandCreateGenerator(&gen, CURAND_RNG_PSEUDO_DEFAULT);
curandSetPseudoRandomGeneratorSeed(gen, 42);
curandGenerateUniform(gen, params, N);
curandGenerateUniform(gen, grads, N);
curandGenerateUniform(gen, m, N);
curandGenerateUniform(gen, v, N);
curandDestroyGenerator(gen);
float lr = 1e-3f, beta1 = 0.9f, beta2 = 0.999f, eps = 1e-8f, wd = 0.01f;
int t = 1;
// warmup
for (int i = 0; i < 5; i++) {
adamw_update(params,
(float*)NULL,
grads,
m,
v,
N,
/*not a multi gpu setup so 0 for shard widths*/
0, /*w_stride=*/
0, /*g_stride=*/
0, /*s_stride=*/
1, /*num_slices=*/
lr,
beta1,
beta2,
t,
eps,
wd,
1.0f, /*grad_scale=*/
42u, /*seed=*/
0 /*stream=*/
);
}
cudaDeviceSynchronize(); // complete warmup before profiling begins
// profile
adamw_update(params, (float*)NULL, grads, m, v,
N, 0, 0, 0, 1, lr, beta1, beta2, t, eps, wd,
1.0f, 42u, 0);
cudaDeviceSynchronize();
cudaFree(params);
cudaFree(grads);
cudaFree(m);
cudaFree(v);
return 0;
}
we warmup before the actual profile with --launch-skip 5 to get rid of any context initialization (lazy loading of gpu context on initial load), JIT compilation (ptx->sass on first launch), l2 cache warming or clock boosting (in case gpu is idling in lower frequency).
in essence the script allocates ~1M float parameters, fills them with random data via cuRAND, warms up with 5 kernel launches, then runs 1 final launch for ncu to profile. I compile it
$ nvcc -O3 -arch=sm_75 -lcurand profile_adamw.cu -o profile_adamwnote for my future self: Change -arch=sm_75 to match the target GPU, e.g. sm_86 for RTX 3090, sm_89 for RTX 4090, sm_80 for A100.
or can just find it with :
$ nvidia-smi --query-gpu=compute_cap --format=csv,noheader
7.5
7.5 means sm_75
anyways, next up ncu:
$ sudo ncu --section SpeedOfLight --section SpeedOfLight_RooflineChart --print-details all --kernel-name "adamw_kernel3" --launch-skip 5 --launch-count 1 ./profile_adamw


==PROF== Connected to process 243320 (/llm.c/profile_adamw)
GPU: NVIDIA GeForce MX450
==PROF== Profiling "adamw_kernel3": 0%....50%....100% - 9 passes
Done.
==PROF== Disconnected from process 243320
[243320] profile_adamw@127.0.0.1
  void adamw_kernel3<float, float>(T1 *, float *, T2 *, float *, float *, unsigned long, long, long, long, float, float, float, float, float, float, float, float, unsigned int) (2048, 1, 1)x(512, 1, 1), Context 1, Stream 7, Device 0, CC 7.5
    Section: GPU Speed Of Light Throughput
    ----------------------- ----------- ------------
    Metric Name             Metric Unit Metric Value
    ----------------------- ----------- ------------
    DRAM Frequency                  Ghz         3.49
    SM Frequency                    Ghz         1.39
    Elapsed Cycles                cycle      845,438
    Memory Throughput                 %        86.36
    DRAM Throughput                   %        86.36
    Duration                         us       606.56
    L1/TEX Cache Throughput           %         7.98
    Waves Per SM                               73.14
    L2 Cache Throughput               %        28.42
    SM Active Cycles              cycle   843,909.21
    Compute (SM) Throughput           %         7.12
    ----------------------- ----------- ------------

    GPU Throughput Chart
    Table Name : GPU Throughput
    ---------------- ----------- ------------
    Metric Name      Metric Unit Metric Value
    ---------------- ----------- ------------
    Memory [%]                 %        86.36
    Compute (SM) [%]           %         7.12
    ---------------- ----------- ------------

...

    INF   This workload is utilizing greater than 80.0% of the available compute or memory performance of this device.
          To further improve performance, work will likely need to be shifted from the most utilized to another unit.
          Start by analyzing DRAM in the Memory Workload Analysis section.

    Section: GPU Speed Of Light Roofline Chart (Overview)
    ----------------------------------------------------------- ----------- ------------
    Metric Name                                                 Metric Unit Metric Value
    ----------------------------------------------------------- ----------- ------------
    Theoretical Predicated-On DFMA Thread Instructions Executed  inst/cycle           28
    Theoretical Predicated-On FFMA Thread Instructions Executed  inst/cycle          896
    Predicated-On DFMA Thread Instructions Executed Per Cycle    inst/cycle            0
    Predicated-On FFMA Thread Instructions Executed Per Cycle    inst/cycle        28.46
    ----------------------------------------------------------- ----------- ------------

	 Achieved Traffic
	-------------- ----------- ------------
	Metric Name    Metric Unit Metric Value
	-------------- ----------- ------------
	DRAM Bandwidth     Gbyte/s        48.17
	-------------- ----------- ------------
.....

    INF   The ratio of peak float (FP32) to double (FP64) performance on this device is 32:1. The workload achieved 4% of this device's FP32 peak performance and 0% of its FP64 peak performance. See the Profiling Guide (https://docs.nvidia.com/nsight-compute/ProfilingGuide/index.html#roofline) for more details on roofline analysis.
Answer for Q2: The kernel achieved 86.43% of theoretical peak memory bandwidth, that's ~48.4 GB/s out of the 56.02 GB/s maximum. The compute throughput is only 7.11%, confirming this is a memory-bandwidth-bound kernel.
finally I wanna see the ncu ui so i ran
$ sudo ncu -o adamw_profile --set full --kernel-name "adamw_kernel3" --launch-skip 5 --launch-count 1 ./profile_adamw

==PROF== Connected to process 244230 (/llm.c/profile_adamw)
GPU: NVIDIA GeForce MX450
==PROF== Profiling "adamw_kernel3": 0%....50%....100% - 33 passes
Done.
==PROF== Disconnected from process 244230
==PROF== Report: /llm.c/adamw_profile.ncu-rep


$ ncu-ui adamw_profile.ncu-rep
this opens the ncu-ui. there's so much there that i couldn't possibly list it here, but I'll be spending some time going over it and making notes.
right now i'm itching to optimize the kernel and see how it affects the memory bound behaviour of this kernel, but i must breathe. ncu-ui isn't something i've ever delved into and there seems to be an ocean of information there so i'll calm myself dowqn and study it a bit before i move onto part 2.
also passing thought, I should probably push these scripts in a repo in case anyone ever needs to use them.
i was looking through the ncu-ui. it looks like a lot, but its actually a few metrics that matter, so i can optimise this kernel to its full potential
the first optimization ncu directs me to make in the kernel is this:

in the details section:

- Compute throughput: 7%
- Memory throughput: 86%
- FP32 peak utilization: 4%
---> Compute pipes are asleep essentially

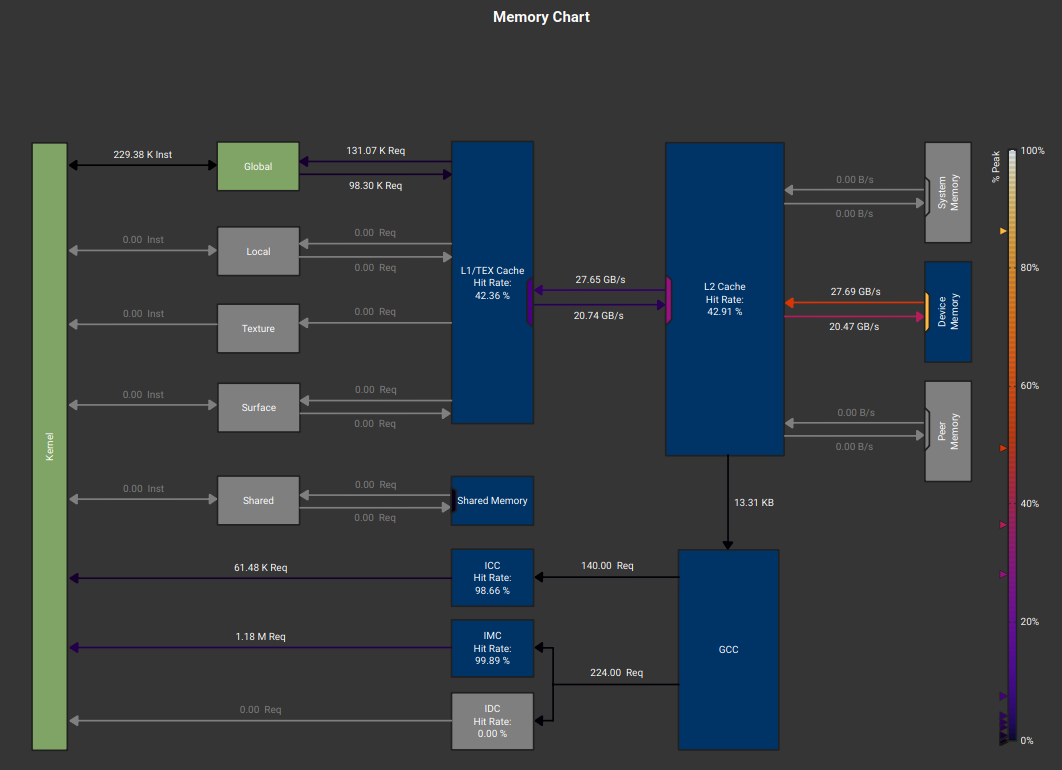
- L1 hit rate: 42%
- L2 hit rate: 42%
- DRAM throughput: high (86%)
Most loads miss L1, half miss L2. They go to DRAM for everything, so this could definitely be improved.
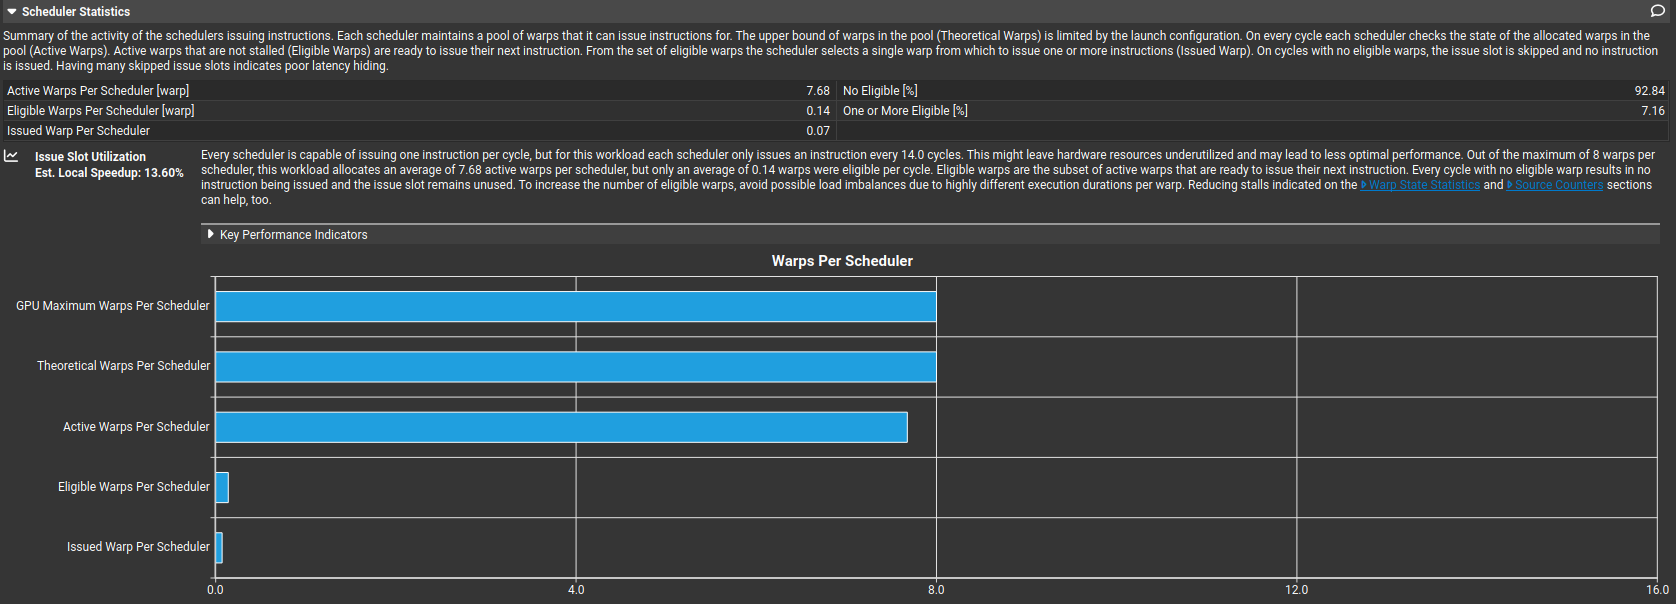
- Eligible warps per scheduler: 0.14
So warps exist, but they are all stalled together. High occupancy does not help when all warps are doing the same load, all warps stall on the same latency or no instruction-level parallelism exists so another thing we gotta fix.
also - Issued IPC active: 0.29 ---> Each scheduler issues one instruction every ~14 cycles


there's also the Sass in "Source" tab but lets not go there right now. i'll get lost in assembly. for now we have the metrics and we know what we have to work on when we'd like to optimize this adamw kernel for llm.c:
Key things i gathered about the adam_kernel3 for now on my tiny gpu
- smsp_average_long_scoreboard = 101 cycles
- Warp cycles per instruction ≈ 107
- 94% of cycles are long scoreboard stalls
- Eligible warps per scheduler = 0.14
- Issued warp per scheduler = 0.07
- No Eligible = 92.8%
Almost every cycle, the scheduler has nothing ready to issue, because warps are waiting on L1TEX (global memory) dependencies. i'll need to improve this for sure.
off the top, things i can think of to improve this are:
- increase arithmetic intensity (using fuse operations, combine passes and avoid writing intermediate results to DRAM)
- increase data reuse (using shared memory tiling, register blocking. i could also reuse loaded values across threads in a block and ensure fully coalesced loads. lets see which one will give better performace)
gemini says: your improvement plan should be:
- Vectorize loads (float4)
- Fuse update steps
- Use FMA aggressively
- Reduce memory traffic by 2–3x
cool, i'll try those as well.
Part 2
I'm a little down today, shit ton weighing on my brain. but lets get cracking.
Today I wanna answer only one questions: how can i improve the kernel to improve the performance I previously saw in ncu-ui? I have ideas that were listed above, but what code do i need to execute these?
Step 1: the ncu-ui gave me the first warning: On average, each warp of this workload spends 100.9 cycles being stalled waiting for a scoreboard dependency on a L1TEX (local, global, surface, texture) operation. Find the instruction producing the data being waited upon to identify the culprit. To reduce the number of cycles waiting on L1TEX data accesses verify the memory access patterns are optimal for the target architecture, attempt to increase cache hit rates by increasing data locality (coalescing), or by changing the cache configuration. Consider moving frequently used data to shared memory. This stall type represents about 94.1% of the total average of 107.3 cycles between issuing two instructions.
so i'll try to fix this first
as i've been reading the llm.c code and thinking about a usual training lifecycle, I understand why the contributors havent tried to optimize the performance of adamw too much. if you think about the training lifecycle, the forward and backward pass (in reverse) would be dominated by matmuls via attention, layernorm, GELU. then one pass over the optimizers over all params. forward/backward passes would have O(n^3) or O(n^2) time complexity whereas the simple adamw would have a linear O(n) complexity, so it makes perfect sense to optimise something that hurts you so much more than something that doesn't.
but regardless, i wanna optimise this as an exercise for myself.
but wait, i realized im doing something stoopid. they have so many kernels already optimized in llm.c dev/ repo. i'm gonna study them for a couple days, develop a better sense of optimizing kernels first, and then return to this. makes more sense than hitting a wall and then vibe coding it. better for learning anyways.
(in-progress)